
About
Honeycomb is a next-generation observability platform designed for the complexity of AI-era software. Unlike traditional monitoring tools that rely on rigid dashboards and slow queries, Honeycomb is built around a custom columnar data store engineered to handle massive volumes of structured telemetry data—including logs, metrics, and traces—at sub-second query speeds. Engineering teams can send unlimited structured data without paying extra for additional context. Honeycomb's OpenTelemetry-compatible ingest pipeline supports any structured data format, while its Telemetry Pipeline lets teams collect, enrich, filter, sample, route, and shape data before it lands in storage—keeping costs predictable and insights sharp. A standout capability is Honeycomb Intelligence, which includes Canvas, an AI-assisted investigation copilot, and an MCP integration that allows AI agent IDEs to query observability data directly. This makes every engineer—regardless of experience level—capable of rapid incident diagnosis. BubbleUp surfaces anomalies automatically, while SLOs and Service Maps provide high-level reliability visibility. Honeycomb is especially valuable for teams operating LLM-powered applications, offering dedicated LLM observability features to monitor model behavior, latency, and errors in production. It integrates with 60+ tools across the software development lifecycle, including AWS, Azure, GCP, and Kubernetes. Ideal for DevOps engineers, SREs, and platform teams at high-growth startups and enterprises who need fast, deep, cost-efficient observability without compromising on data richness.
Key Features
- Sub-Second Query Engine: Purpose-built columnar data store delivers lightning-fast query results across billions of telemetry events, enabling real-time investigation without dashboard dead-ends.
- LLM Observability: Monitor and debug LLM-powered applications in production, tracking model behavior, latency, errors, and usage patterns with the same unified telemetry pipeline.
- Honeycomb Intelligence & Canvas: AI-assisted investigation copilot that accelerates root cause analysis, surfaces anomalies via BubbleUp, and integrates with AI agent IDEs through MCP.
- Unified Telemetry Pipeline: Ingest logs, metrics, and traces from any OpenTelemetry-compatible source. Enrich, filter, sample, and route data to control costs while maximizing insight depth.
- 60+ Integrations: Seamlessly connects with AWS, Azure, GCP, Kubernetes, and 60+ tools across the software development lifecycle for end-to-end observability coverage.
Use Cases
- Debugging distributed microservices incidents by tracing requests end-to-end across services with sub-second query turnaround.
- Monitoring LLM-powered applications in production to track model latency, token consumption, hallucinations, and error rates.
- Setting and maintaining customer-facing SLOs with real-time service maps and automated anomaly detection via BubbleUp.
- Controlling observability costs by using the Telemetry Pipeline to filter, sample, and route high-volume telemetry data intelligently.
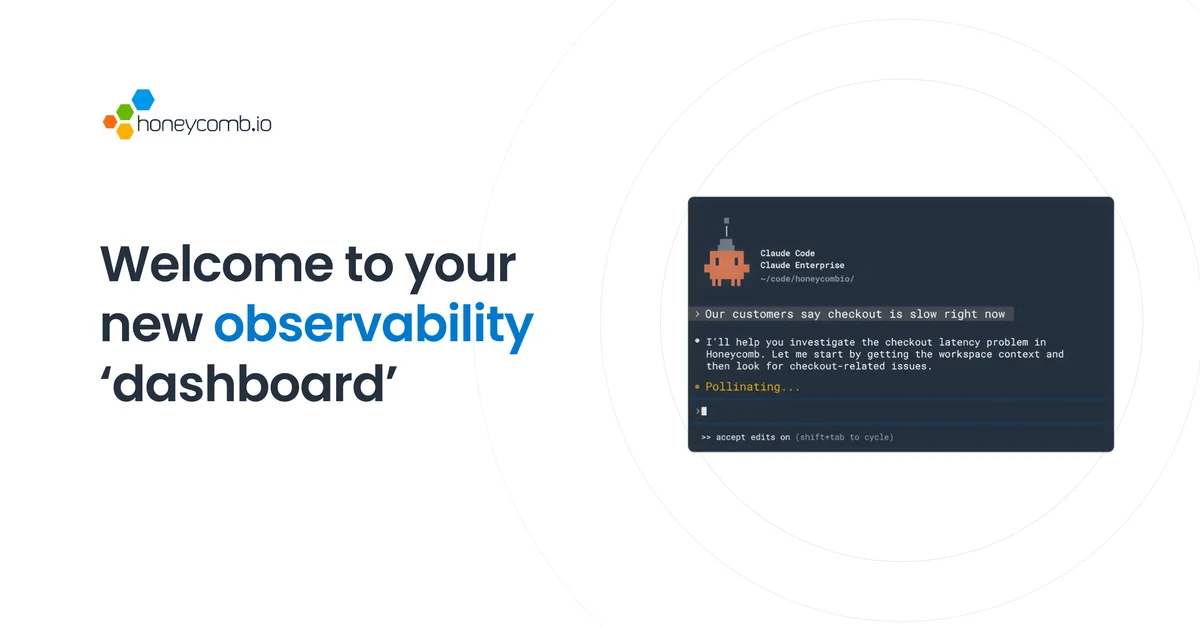
- Enabling AI agent IDEs to query production observability data directly via Honeycomb MCP, keeping developers in their coding flow during incident response.
Pros
- Unmatched Query Speed: The custom-built columnar store returns results in sub-seconds even on high-cardinality, high-volume datasets—far faster than traditional observability tools.
- AI-Native Investigations: Canvas AI copilot and MCP integration make it easy for any engineer to diagnose incidents quickly without needing deep expertise in query languages or data structures.
- Cost-Efficient Telemetry: Send unlimited structured data and derive unlimited custom metrics for free—no per-metric charges or data volume penalties for adding context.
- Strong OpenTelemetry Support: First-class compatibility with OpenTelemetry standards makes instrumentation straightforward and vendor lock-in minimal.
Cons
- Learning Curve for New Users: The query model and high-cardinality data concepts differ from traditional monitoring tools, requiring some onboarding time for teams migrating from dashboards-first platforms.
- Cost at Enterprise Scale: While the free tier is generous, costs can escalate significantly for large organizations with very high telemetry volumes, making budget planning critical.
- Primarily Web-Based: The platform is accessed through the web with no native desktop application, which may be a constraint in certain secure or offline environments.
Frequently Asked Questions
What makes Honeycomb different from traditional monitoring tools like Datadog or New Relic?
Honeycomb is purpose-built for high-cardinality observability, using a custom columnar data store that delivers sub-second queries on raw event data. Unlike traditional tools that aggregate metrics into dashboards, Honeycomb lets you explore any dimension of your data interactively without pre-defining what to monitor.
Does Honeycomb support OpenTelemetry?
Yes. Honeycomb is fully OpenTelemetry-compatible and encourages instrumentation using OTel SDKs. It accepts any structured telemetry data—traces, logs, and metrics—from any OTel-compatible source.
What is LLM Observability in Honeycomb?
Honeycomb's LLM observability features let teams monitor AI-powered applications in production. You can track model latency, token usage, error rates, and behavioral patterns using the same unified telemetry pipeline as the rest of your stack.
Is there a free plan available?
Yes. Honeycomb offers a free tier that allows teams to get started with observability at no cost. Paid plans unlock higher data volumes, longer retention, advanced features, and enterprise-grade support.
What is Canvas and how does it help with incident investigations?
Canvas is Honeycomb's AI-assisted investigation copilot. It helps engineers quickly understand anomalies, construct queries, and correlate signals during an incident—reducing mean time to resolution (MTTR) by surfacing relevant insights automatically.