S
About
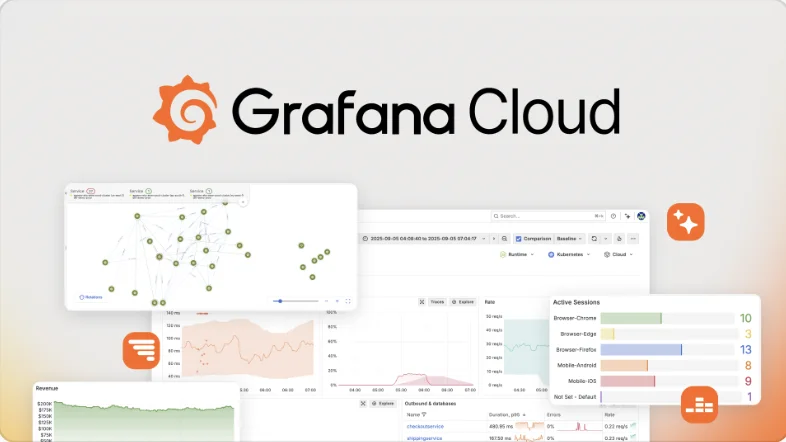
Grafana Cloud is a comprehensive, cloud-hosted observability platform from Grafana Labs, designed to give engineering teams full visibility into their systems from a single, unified dashboard. It monitors metrics, logs, distributed traces, and continuous profiling data, enabling faster incident detection, diagnosis, and resolution. The platform features AI-assisted onboarding that helps teams get insights in minutes, and AI-powered agents that accelerate incident response using a knowledge graph of your system context. Its Adaptive Telemetry engine intelligently filters noise and amplifies critical signals, helping teams cut observability costs by 35–50% across metrics, logs, and traces. Grafana Cloud is built on open standards including OpenTelemetry and integrates with a wide ecosystem of plugins and data sources, ensuring teams keep using the tools they already love without lock-in. Out-of-the-box dashboards and monitoring integrations make it easy to get started immediately. For security-conscious organizations, Grafana Cloud meets SOC 2, GDPR, and PCI compliance requirements, with FedRAMP High and DoD IL5 authorization available via Grafana Federal Cloud. Tiered plans scale from a permanently free offering for individuals and startups, through self-serve Pro plans, up to enterprise-grade deployments with guaranteed SLAs and extended retention.
Key Features
- AI-Assisted Onboarding & Workflows: Get instant visibility into your systems in minutes with guided, AI-powered setup and out-of-the-box monitoring integrations.
- Adaptive Telemetry: Automatically amplifies the most important signals and filters noise, reducing observability costs by 35–50% across metrics, logs, and traces.
- Unified Full-Stack Observability: Correlate metrics, logs, distributed traces, and continuous profiling data in a single platform for end-to-end system visibility.
- AI-Powered Incident Resolution: Context-rich alerts enriched by a knowledge graph of your systems help teams resolve incidents faster and reduce alert fatigue.
- Open Standards & Ecosystem Integrations: Built on OpenTelemetry and compatible with a broad plugin ecosystem, enabling flexible integration with existing tools and data sources without vendor lock-in.
Use Cases
- DevOps and SRE teams monitoring infrastructure health, uptime, and performance across cloud-native and hybrid environments.
- Engineering teams performing root cause analysis during incidents using correlated metrics, logs, and distributed traces.
- Platform engineers implementing observability-as-code using Grafana Cloud's Git Sync and standardized OpenTelemetry instrumentation.
- Cost-conscious organizations optimizing their telemetry pipeline to reduce data storage and ingestion expenses with Adaptive Telemetry.
- Enterprise security and compliance teams requiring observability tooling that meets SOC 2, GDPR, PCI, or FedRAMP standards.
Pros
- Generous Permanent Free Tier: The always-free plan includes access to all Grafana Cloud services with usage limits, making it ideal for individuals, side projects, and early-stage startups.
- Significant Cost Savings: Adaptive Telemetry cuts observability spend by 35–50%, and the bring-your-own-cloud option provides further flexibility in cost management.
- No Vendor Lock-In: Open standards like OpenTelemetry and a plugin-rich ecosystem let teams connect existing tools freely and migrate without friction.
- Enterprise-Grade Security & Compliance: Meets SOC 2, GDPR, and PCI standards, with FedRAMP High and DoD IL5 authorization available for government and highly regulated industries.
Cons
- Usage-Based Cost Complexity: Costs can scale unexpectedly at high data volumes, requiring careful monitoring of ingestion rates to avoid billing surprises on paid plans.
- Steep Learning Curve for New Users: The breadth of features and configuration options across metrics, logs, traces, and profiles can be overwhelming for teams new to observability platforms.
- Short Retention on Free Tier: The free plan limits data retention to 14 days for metrics, logs, traces, and profiles, which may be insufficient for long-term trend analysis.
Frequently Asked Questions
What is Grafana Cloud?
Grafana Cloud is a fully managed, AI-powered observability platform from Grafana Labs that consolidates metrics, logs, distributed traces, and continuous profiling into a single unified interface, helping teams monitor and troubleshoot their systems more efficiently.
How much does Grafana Cloud cost?
Grafana Cloud offers a permanently free tier with no charges ever, suitable for personal projects and early startups. Paid Pro plans start at $19/month plus usage, with enterprise tiers available for larger organizations needing extended retention, SLAs, and advanced support.
Does Grafana Cloud support OpenTelemetry?
Yes. Grafana Cloud is built on open standards including OpenTelemetry, enabling teams to instrument their applications once and send telemetry data to Grafana Cloud without proprietary agents or lock-in.
What compliance certifications does Grafana Cloud hold?
Grafana Cloud meets SOC 2, GDPR, and PCI compliance requirements. For government workloads, Grafana Federal Cloud offers FedRAMP High and DoD IL5 authorization.
How does Adaptive Telemetry reduce costs?
Adaptive Telemetry is an intelligent data management feature that automatically identifies and retains the most important signals while filtering out low-value noise. This can reduce costs by 35–50% across metrics, logs, and traces without sacrificing observability quality.