L
About
Honeycomb is a full-stack observability platform designed for the AI era of software engineering. It ingests logs, metrics, and distributed traces from any OpenTelemetry-compatible source into a custom-built columnar data store engineered for high-volume, high-cardinality telemetry. Teams can append unlimited business and technical context to their events without incurring extra costs, enabling richer investigations without data trade-offs. Honeycomb Intelligence and the Canvas AI copilot transform raw telemetry into instant answers—engineers can ask natural-language questions and receive guided query suggestions, dynamic visualizations, and anomaly highlights in seconds rather than hours. BubbleUp automatically surfaces statistically significant differences in your data, dramatically reducing time-to-insight during incidents. A built-in Telemetry Pipeline lets teams collect, enrich, filter, sample, and route data before it lands, keeping costs predictable at any scale. The platform supports LLM and AI agent observability out of the box, making it ideal for teams building AI-powered products who need visibility into model behavior, latency, and errors. With 60+ integrations spanning CI/CD, incident management, and IDE tooling (including an MCP server for AI agent access), Honeycomb fits naturally into modern engineering workflows. It is trusted by innovative startups and large enterprises alike for use cases including incident response, DevOps and release monitoring, cloud migrations, frontend performance, and meeting customer SLAs.
Key Features
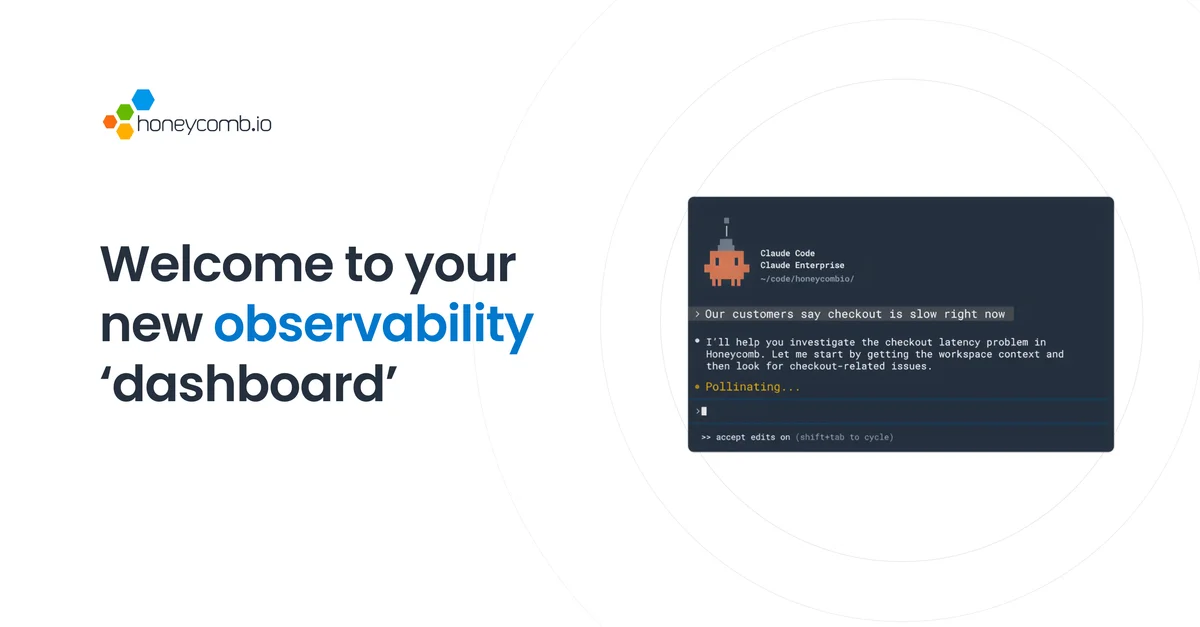
- AI-Powered Canvas Copilot: An AI-assisted investigation tool that answers natural-language observability questions, generates queries, and surfaces insights in seconds rather than hours.
- Unified Telemetry Ingestion: Ingest logs, metrics, and distributed traces from any OpenTelemetry-compatible source into a single platform with no extra cost for added context or custom metrics.
- BubbleUp Anomaly Detection: Automatically identifies statistically significant patterns and anomalies in your telemetry data, pinpointing root causes during incidents without manual correlation.
- Telemetry Pipeline: Collect, enrich, filter, sample, and route telemetry data before storage to control costs, improve signal quality, and ensure data reaches the right destinations.
- LLM & AI Agent Observability: Dedicated support for monitoring AI-powered applications and LLM workloads, including latency, error rates, and model behavior with native IDE and MCP integrations.
Use Cases
- Debugging production incidents in distributed microservices architectures by tracing requests end-to-end and isolating root causes with BubbleUp.
- Monitoring LLM-powered applications and AI agents for latency spikes, error rates, and unexpected model behavior in real time.
- Tracking and meeting customer-facing SLOs by correlating service performance with business impact metrics across the full stack.
- Accelerating DevOps release cycles by monitoring deployment health and catching regressions immediately after code ships.
- Controlling observability costs at scale by using the Telemetry Pipeline to filter, sample, and route data before ingestion.
Pros
- Subsecond Query Performance: Honeycomb's purpose-built columnar data store delivers extremely fast query results even over massive, high-cardinality datasets, enabling real-time investigation.
- OpenTelemetry Native: Fully compatible with the OpenTelemetry standard, making it straightforward to instrument existing services and avoid vendor lock-in on data collection.
- No Cost for Extra Context: Teams can add unlimited custom attributes and derive unlimited custom metrics at no additional charge, encouraging richer instrumentation and deeper insights.
- AI-Accelerated Investigations: Canvas AI copilot and Honeycomb Intelligence dramatically reduce mean time to resolution by guiding engineers directly to relevant signals and root causes.
Cons
- Cost at High Data Volumes: While context is free, pricing is data-volume based and can become significant for organizations ingesting very large amounts of event data at scale.
- Learning Curve for Observability Newcomers: Teams unfamiliar with high-cardinality observability concepts or distributed tracing may need time and training to get the most out of Honeycomb's capabilities.
- Overkill for Simple Monoliths: Smaller or simpler applications may not require the depth of distributed tracing and telemetry analysis Honeycomb provides, making lighter tools more appropriate.
Frequently Asked Questions
What is Honeycomb and who is it for?
Honeycomb is an observability platform for software engineering teams who build and operate distributed systems, cloud-native applications, and AI-powered products. It is used by startups and enterprises to debug incidents faster, monitor SLOs, and understand system behavior in production.
Does Honeycomb support OpenTelemetry?
Yes. Honeycomb is fully OpenTelemetry-compatible. You can use OTel SDKs and collectors to instrument your services and send data directly to Honeycomb without any proprietary agents.
What is Honeycomb Canvas and Honeycomb Intelligence?
Canvas is an AI-assisted copilot embedded in the Honeycomb UI that helps engineers write queries, interpret results, and investigate incidents using natural language. Honeycomb Intelligence is the broader suite of AI-powered features, including anomaly detection and automated insight generation.
Is there a free plan available?
Yes. Honeycomb offers a free tier that allows teams to start sending data and exploring the platform without a credit card. Paid plans unlock higher data volumes, longer retention, and enterprise features.
Can Honeycomb be used for LLM and AI agent observability?
Yes. Honeycomb has dedicated support for LLM observability use cases, enabling teams to monitor model latency, error rates, token usage, and agent behavior. It also offers an MCP server so AI agent IDEs can query observability data directly.