M
About
Light Pollution Map is a comprehensive, free astronomical planning tool designed for stargazers, astrophotographers, and astronomy enthusiasts worldwide. The app overlays detailed light pollution data onto interactive maps, sourced from satellite observations spanning 2012 to 2025, giving users both current conditions and historical trend analysis at any location on Earth. At its core, the tool uses the Bortle Scale and Sky Quality Meter (SQM) values to quantify light pollution levels, helping users identify certified dark-sky places and pristine Milky Way viewing sites. A built-in exposure calculator lets astrophotographers compute equivalent exposure times based on local light pollution class, dramatically improving image planning. Beyond light pollution, the platform integrates live aurora probability forecasts from NOAA, real-time cloud and rain weather overlays, and a day/night terminator layer. Users can explore lunar phases, moon illumination, and precise moon-rise/set times. The 3D All-Sky Dome renders a WebGL star map for any selected location, while the Best Stargazing Spots Finder intelligently searches a configurable radius for optimal observation points, filtering out ocean and lake areas. Available as a web app and free mobile apps on iOS and Android, Light Pollution Map serves casual stargazers, serious amateur astronomers, astrophotography hobbyists, aurora chasers, and outdoor photographers seeking golden-hour and night-sky conditions. Its multilingual interface (20+ languages) makes it globally accessible.
Key Features
- Historical Light Pollution Layers (2012–2025): Browse year-by-year satellite-based light pollution overlays to track changes and identify improving dark-sky areas over more than a decade.
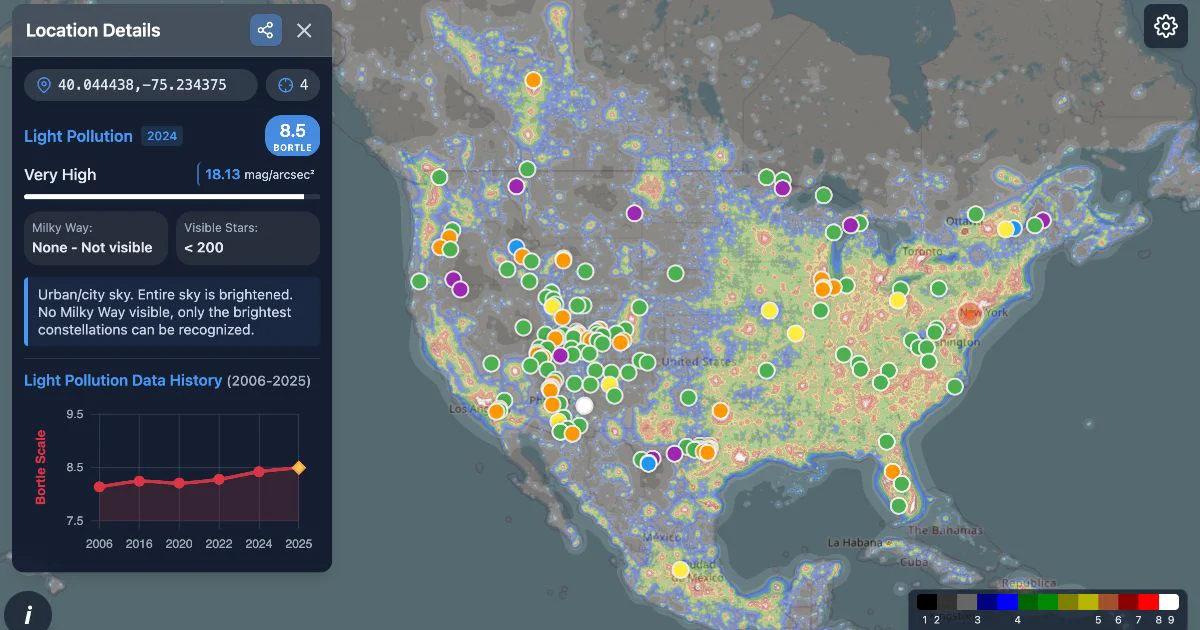
- Bortle Scale & SQM Data: Click any point on the map to instantly retrieve Bortle class and Sky Quality Meter values, plus visible star counts and Milky Way visibility estimates.
- Aurora & Weather Overlays: Overlay live NOAA aurora probability, cloud cover, and rain layers to assess complete nighttime observing conditions in one view.
- Astrophotography Exposure Calculator: Compute equivalent exposure times for any location's Bortle class or SQM value, helping photographers optimize long-exposure night shots.
- Best Stargazing Spots Finder: Automatically search within a configurable radius for the darkest nearby locations, with smart filtering to exclude oceans, lakes, and clustered results.
Use Cases
- Amateur astronomers scouting the nearest certified dark-sky park for a weekend observation session
- Astrophotographers calculating optimal exposure times and selecting low-light-pollution sites for Milky Way photography
- Aurora chasers combining aurora probability forecasts with dark-sky data to choose the best viewing location
- Astronomy educators demonstrating light pollution trends to students using 13 years of historical satellite data
- Outdoor photographers finding golden-hour and night-sky shooting locations with minimal light interference
Pros
- Completely Free: The full web app and mobile apps are available at no cost, with no paywalled core features, making it accessible to everyone.
- Rich Multi-Layer Data: Combines light pollution, aurora probability, weather, lunar phase, and 3D sky maps in a single unified interface.
- Long Historical Record: Over 13 years of annual light pollution data enables meaningful trend analysis and long-term site evaluation.
- Global Multilingual Support: Available in 20+ languages, making the tool useful for astronomy communities around the world.
Cons
- No Personalized Alerts: The web app lacks push notification support for optimal viewing windows; users must check conditions manually or use the companion mobile app.
- Aurora Layer Still in Beta: The aurora probability overlay is labeled as beta, meaning accuracy and reliability may be inconsistent in some regions.
- Limited Urban Planning Features: The tool is focused on observation planning rather than environmental reporting, so it lacks data export or policy-focused analytics for researchers.
Frequently Asked Questions
What is the Bortle Scale?
The Bortle Scale is a nine-level numeric scale that measures the brightness of the night sky at a given location. Bortle 1 represents the darkest skies, while Bortle 9 represents heavily light-polluted inner-city skies. Light Pollution Map displays the Bortle class for any point you click on the map.
How current is the light pollution data?
The primary map uses 2024/2025 satellite data, updated annually. Historical layers are available from 2012 through 2025, allowing year-over-year comparison.
Is Light Pollution Map free to use?
Yes, the web app and the companion StargazingHub mobile apps (iOS and Android) are free to download and use with full access to core features.
Can I use it on my smartphone in the field?
Yes. The free StargazingHub app for iOS and Android includes the light pollution map, tonight's stargazing index, aurora forecasts, and celestial event reminders for on-the-go use.
How does the exposure calculator work?
You enter a reference exposure time at a known Bortle class or SQM value, and the calculator computes the equivalent exposure needed at your current location's light pollution level, helping you plan astrophotography shots accurately.