
M
About
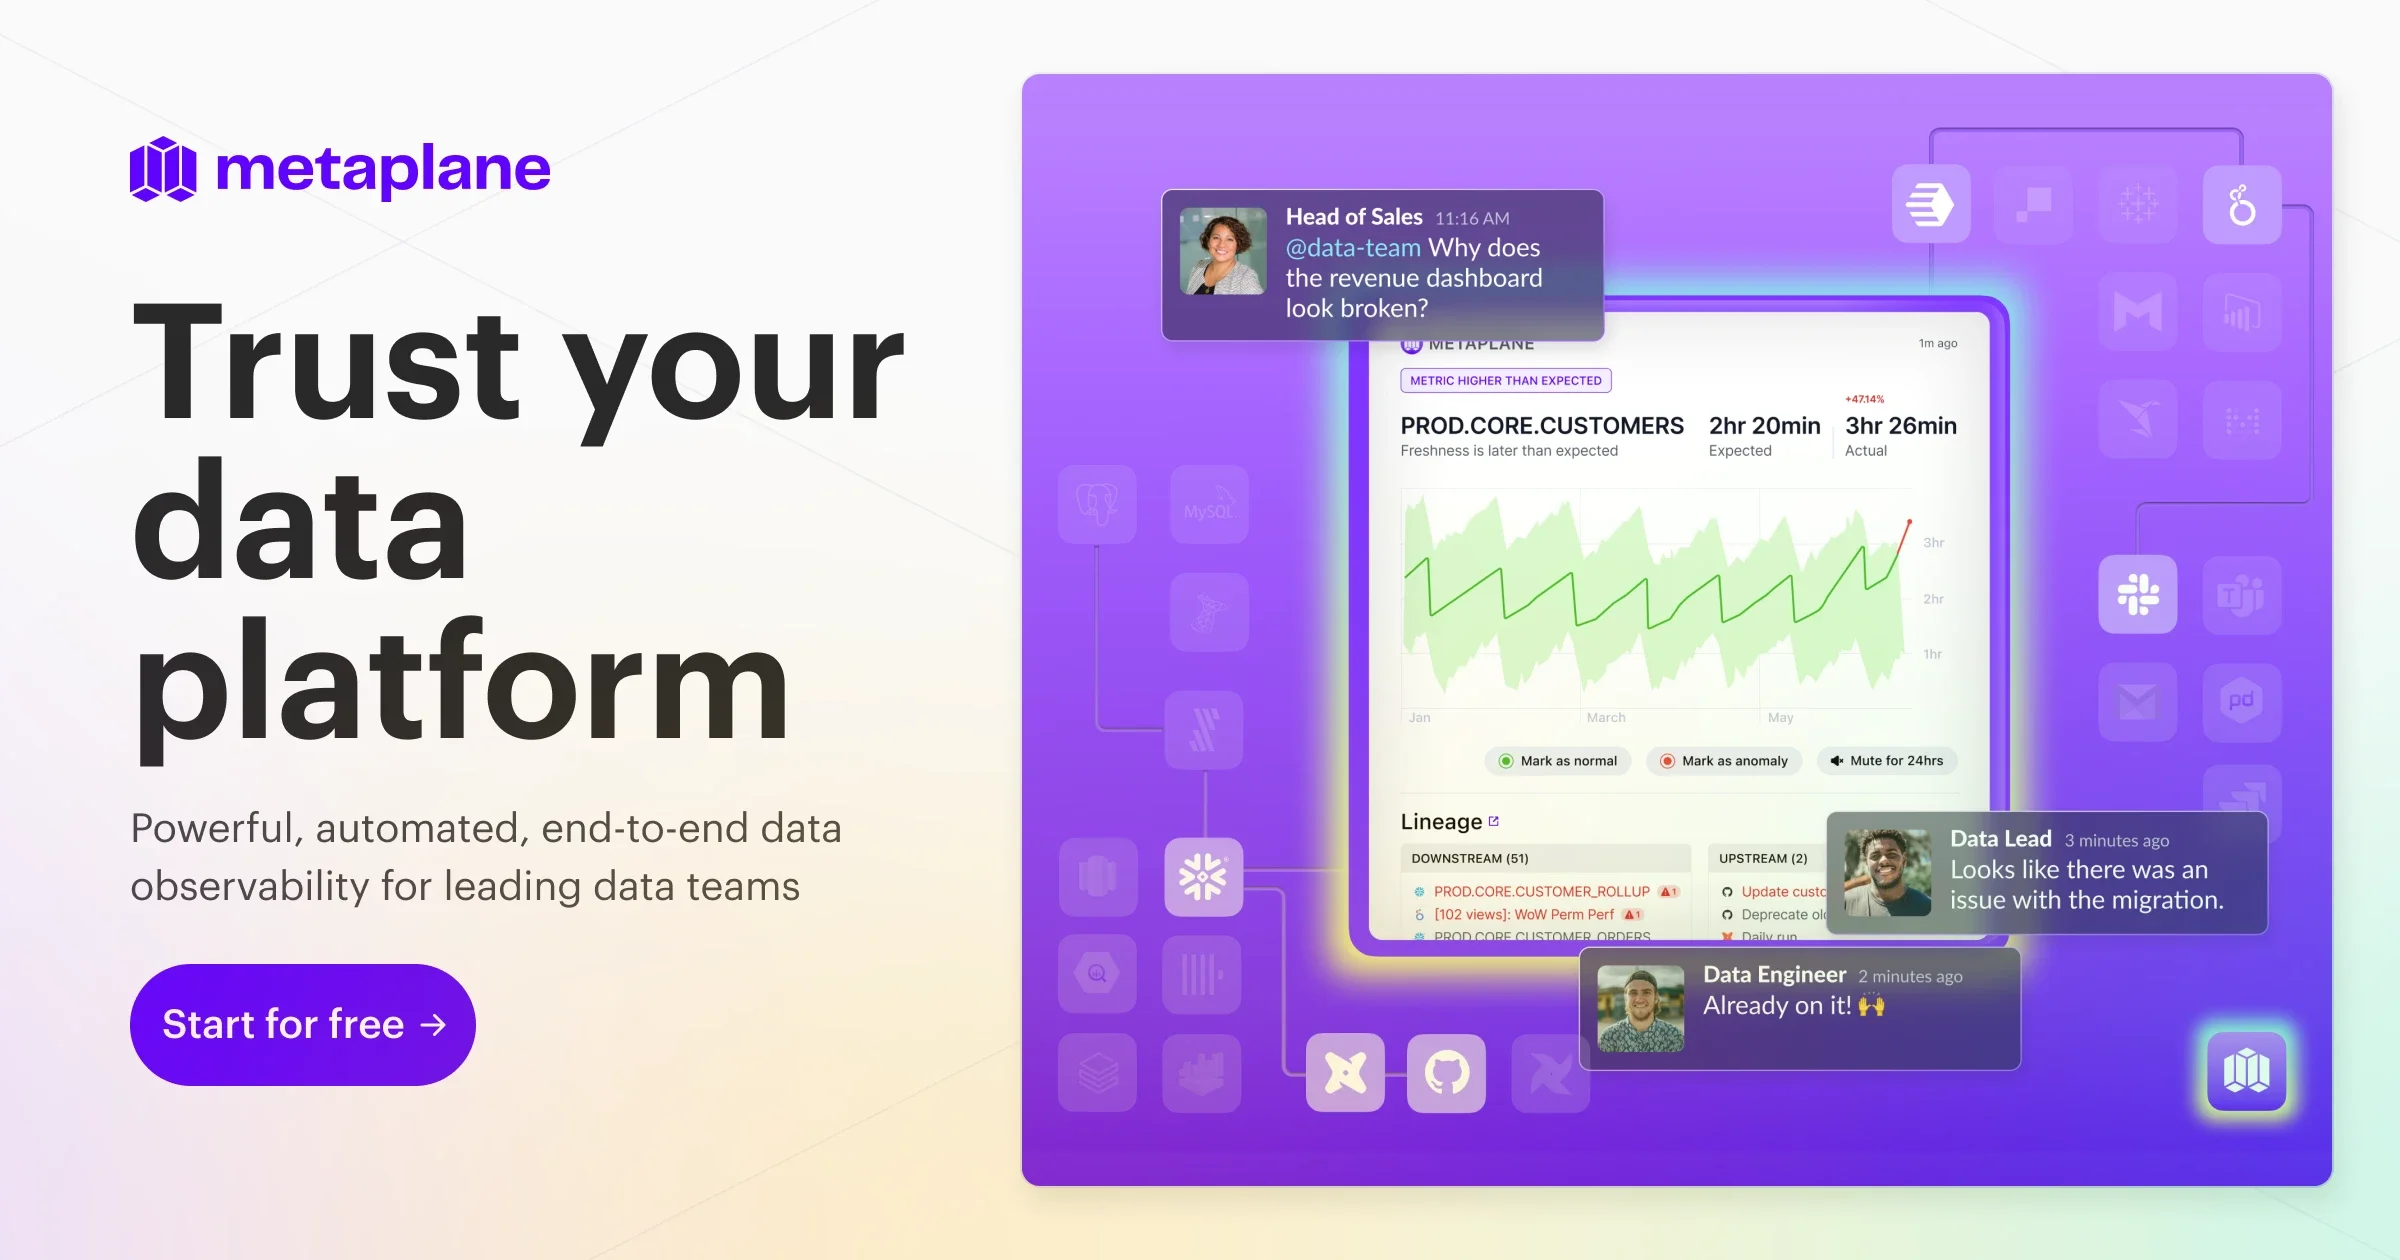
Metaplane (now part of Datadog) is an end-to-end data observability platform built for modern data teams who need to trust their data pipelines. It continuously monitors data quality across warehouses, transformation layers, and BI tools, surfacing issues before they silently corrupt dashboards or downstream decisions. At its core, Metaplane uses ML-powered anomaly detection that accounts for seasonality and trends—something rigid, hand-written tests cannot do. Teams can add and configure monitors without writing any code, segment monitoring by table dimensions, and see alerts within as little as three days of connecting their stack. Setup takes roughly 15 minutes, far faster than competing observability solutions. Beyond monitoring, Metaplane provides full end-to-end, column-level data lineage with no manual configuration required. This gives teams clear visibility into how data flows from ingestion tools like Fivetran and Airbyte through dbt transformations, into warehouses like Snowflake, Redshift, BigQuery, and Databricks, and out to BI tools like Tableau, Looker, and Power BI. Data CI/CD capabilities let teams run automated regression and impact tests directly on pull requests, catching quality regressions before they merge. Data Insights surfaces usage analytics—who queries which tables, how often, and from where—helping teams reduce data debt and prioritize high-value assets. Automated, targeted alerts route to Slack, Jira, or other channels with enough context to resolve incidents quickly. Metaplane is ideal for data engineers, analytics engineers, and data platform teams at growth-stage and enterprise companies.
Key Features
- ML-Powered Anomaly Detection: Machine learning models automatically account for seasonality and trends to flag genuine data quality issues without requiring hand-written threshold rules.
- End-to-End Column-Level Lineage: Automatically maps how data flows from source systems through transformations and warehouses to BI dashboards—with no manual setup required.
- Data CI/CD: Runs automated regression and impact tests on pull requests so data quality issues are caught before they are merged into production pipelines.
- Data Insights & Usage Analytics: Shows which tables and columns are queried, by whom, and how often—helping teams reduce data debt and focus effort on the most-used assets.
- Targeted Automated Alerts: Routes contextual incident notifications to Slack, Jira, and other channels so teams can triage and resolve issues quickly without hunting for context.
Use Cases
- Monitoring data pipeline health in real time so data engineers are alerted to broken or degraded data before stakeholders encounter incorrect dashboard numbers.
- Tracing the root cause of a data incident by following column-level lineage from a broken BI report back through dbt models to the originating source table.
- Enforcing data quality standards in CI/CD workflows by running automated impact tests on every dbt pull request before merging.
- Auditing data asset usage to identify stale, low-value tables that can be deprecated, reducing warehouse compute costs and maintenance burden.
- Centralizing data incident alerting so that on-call data engineers, analytics engineers, and business stakeholders all receive context-rich notifications in Slack or Jira when an issue is detected.
Pros
- Rapid Time to Value: Connects in minutes and surfaces its first anomaly alerts within three days—significantly faster than most competing data observability tools that require weeks of setup.
- No-Code Monitor Configuration: Data teams can add monitors and set up coverage across tables without writing any SQL or code, lowering the barrier for non-engineers.
- Broad Ecosystem Integrations: Natively integrates with all major data warehouses, ingestion tools, dbt, orchestration platforms, and BI tools, making it fit naturally into existing stacks.
- Seasonality-Aware ML Detection: Unlike static threshold monitors, the ML engine learns patterns over time, reducing false positives while catching genuine anomalies that custom tests would miss.
Cons
- Pricing Opacity for Larger Teams: Enterprise and team tier pricing requires contacting sales or booking a demo, making cost estimation difficult without a direct conversation.
- Datadog Ecosystem Alignment: As a Datadog acquisition, future roadmap and pricing may increasingly favor organizations already invested in the Datadog platform.
- Alert Tuning Required Early On: During the initial learning period, teams may need to invest time tuning suggested monitors to reduce noise before alerting reaches a productive signal-to-noise ratio.
Frequently Asked Questions
How long does it take to get started with Metaplane?
Metaplane is designed for fast onboarding—teams typically connect their data stack in under 15 minutes and can expect to see their first anomaly alerts within as little as three days as the ML models learn baseline patterns.
Which data warehouses and tools does Metaplane support?
Metaplane integrates with major data warehouses including Snowflake, BigQuery, Redshift, Databricks, ClickHouse, and AWS S3, as well as ingestion tools (Fivetran, Airbyte), transformation layers (dbt Cloud and Core), BI tools (Looker, Tableau, Power BI, Metabase, Sigma, Hex, Mode), orchestrators (Airflow), and notification channels (Slack, Jira).
How does Metaplane detect data anomalies?
Metaplane uses machine learning models trained on each table's historical data to detect deviations. These models account for seasonality and trends, so they adapt to expected weekly cycles or growth patterns rather than triggering on normal variation.
What is Data CI/CD in Metaplane?
Data CI/CD is Metaplane's capability to run automated regression and impact tests against pull requests in tools like dbt. When a developer merges a change, Metaplane checks whether that change could degrade data quality for downstream consumers before it reaches production.
Is Metaplane part of Datadog?
Yes. Metaplane was acquired by Datadog and the two products are being integrated to bring software observability and data observability together into a unified platform for engineering and data teams.